
Harris County 2020→2024 Election Swing
Precinct-level change in partisan margin from 2020 to 2024 in Harris County. Average swing: 9.8 points toward Republicans. 1172 precincts.
Everything from one publisher
Precinct-level change in partisan margin from 2020 to 2024 in Harris County. Average swing: 9.8 points toward Republicans. 1172 precincts.
Precinct-level results for the 2024 presidential election in Harris County. Harris won 52.0% to 46.4%. 1172 precincts, 1,552,642 total votes.
Precinct-level results for the 2020 presidential election in Harris County. Biden won 56.0% to 42.7%. 1027 precincts, 1,640,818 total votes.
Precinct-level results for the 2024 presidential election in Tarrant County. Trump won 51.8% to 46.8%. 844 precincts, 819,679 total votes.
Precinct-level change in partisan margin from 2020 to 2024 in Tarrant County. Average swing: 4.5 points toward Republicans. 844 precincts.
Precinct-level change in partisan margin from 2020 to 2024 in Bexar County. Average swing: 7.6 points toward Republicans. 776 precincts.
Precinct-level results for the 2024 presidential election in Bexar County. Harris won 54.3% to 44.5%. 776 precincts, 744,817 total votes.
Precinct-level results for the 2020 presidential election in Bexar County. Biden won 58.3% to 40.1%. 760 precincts, 769,142 total votes.
Precinct-level results for the 2020 presidential election in Tarrant County. Biden won 49.3% to 49.1%. 739 precincts, 834,697 total votes.
Precinct-level change in partisan margin from 2020 to 2024 in Travis County. Average swing: 1.6 points toward Democrats. 287 precincts.
Precinct-level results for the 2024 presidential election in Travis County. Harris won 68.9% to 29.3%. 287 precincts, 558,289 total votes.
Precinct-level results for the 2020 presidential election in Hidalgo County. Biden won 58.0% to 41.0%. 267 precincts, 220,884 total votes.
Precinct-level results for the 2024 presidential election in Hidalgo County. Trump won 51.0% to 48.1%. 259 precincts, 217,194 total votes.
Precinct-level change in partisan margin from 2020 to 2024 in Hidalgo County. Average swing: 19.6 points toward Republicans. 259 precincts.
Precinct-level change in partisan margin from 2020 to 2024 in Collin County. Average swing: 3.2 points toward Republicans. 252 precincts.
Precinct-level results for the 2024 presidential election in Collin County. Trump won 54.3% to 43.1%. 252 precincts, 515,167 total votes.
Precinct-level results for the 2020 presidential election in Travis County. Biden won 71.4% to 26.4%. 247 precincts, 610,349 total votes.
Precinct-level results for the 2020 presidential election in Collin County. Trump won 51.3% to 46.9%. 242 precincts, 492,197 total votes.
Precinct-level change in partisan margin from 2020 to 2024 in Denton County. Average swing: 3.1 points toward Republicans. 240 precincts.
Precinct-level results for the 2024 presidential election in Denton County. Trump won 55.6% to 42.9%. 240 precincts, 440,432 total votes.
Precinct-level results for the 2024 presidential election in El Paso County. Harris won 57.0% to 41.8%. 221 precincts, 251,008 total votes.
Precinct-level change in partisan margin from 2020 to 2024 in El Paso County. Average swing: 20.5 points toward Republicans. 221 precincts.
Precinct-level results for the 2020 presidential election in El Paso County. Biden won 66.8% to 31.6%. 210 precincts, 266,648 total votes.
Precinct-level results for the 2020 presidential election in Denton County. Trump won 53.2% to 45.1%. 195 precincts, 417,964 total votes.
Precinct-level change in partisan margin from 2020 to 2024 in Fort Bend County. Average swing: 5.4 points toward Republicans. 175 precincts.
Precinct-level results for the 2024 presidential election in Fort Bend County. Harris won 49.9% to 47.5%. 175 precincts, 343,485 total votes.
Precinct-level results for the 2020 presidential election in Fort Bend County. Biden won 54.6% to 44.0%. 168 precincts, 358,332 total votes.
Precinct-level change in partisan margin from 2020 to 2024 in Williamson County. Average swing: 1.3 points toward Republicans. 164 precincts.
Precinct-level results for the 2024 presidential election in Williamson County. Trump won 50.5% to 47.9%. 164 precincts, 304,767 total votes.
Precinct-level results for the 2020 presidential election in Montgomery County. Trump won 71.2% to 27.4%. 117 precincts, 271,543 total votes.
Precinct-level results for the 2024 presidential election in Montgomery County. Trump won 71.9% to 27.1%. 113 precincts, 277,783 total votes.
Precinct-level change in partisan margin from 2020 to 2024 in Montgomery County. Average swing: 3.2 points toward Democrats. 113 precincts.
Precinct-level results for the 2020 presidential election in Williamson County. Biden won 49.5% to 48.2%. 96 precincts, 287,506 total votes.

4 commissioner precincts for Tarrant County, Texas. Each precinct is represented by an elected county commissioner.

4 commissioner precincts for Bexar County, Texas. Each precinct is represented by an elected county commissioner.
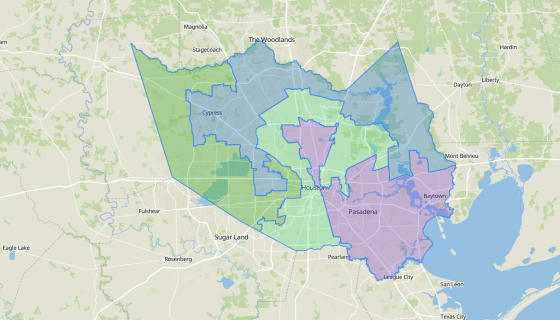
4 commissioner precincts for Harris County, Texas. Each precinct is represented by an elected county commissioner.
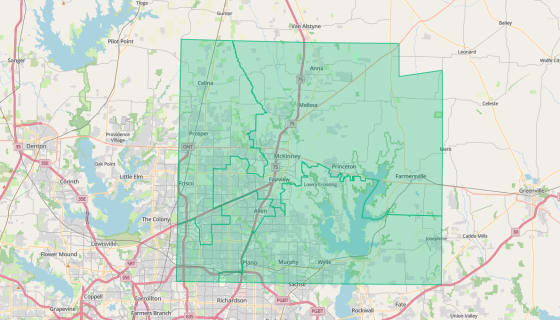
4 commissioner precincts for Collin County, Texas. Each precinct is represented by an elected county commissioner.
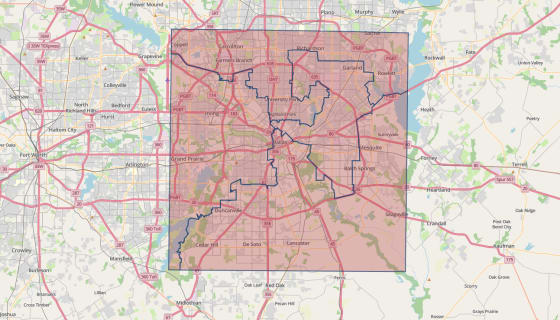
4 commissioner precincts for Dallas County, Texas. Each precinct is represented by an elected county commissioner.
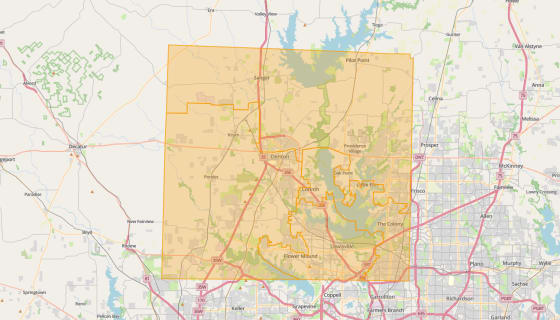
4 commissioner precincts for Denton County, Texas. Each precinct is represented by an elected county commissioner.