
Everything from one publisher
census.gov
- 40 datasets
- 2,312 features
Datasets


Texas Counties - Boundaries
County boundaries for all 254 Texas counties with population and economic data.

Texas Counties — Population Growth 2020-2025
Population change by county from the 2025 Census Population Estimates. Green = growing, red = shrinking. 84 of 254 Texas counties lost population.


Texas Counties Losing Population — 1-Year (2024–2025)
108 Texas counties lost population between 2024 and 2025. Most are in rural West Texas, the Panhandle, and East Texas. King County shrank the most at -9.4%. Source: U.S. Census Bureau Vintage 2025 Population Estimates (M

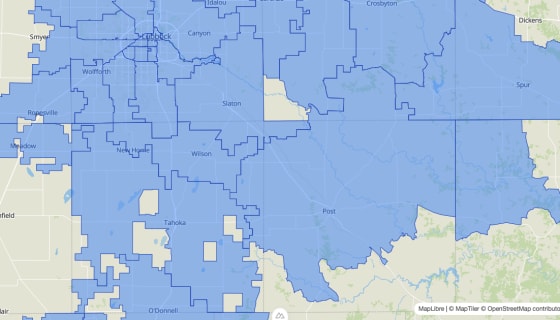
Texas Shrinking Counties (84 of 254)
84 Texas counties lost population between 2020-2025. Most are in rural West Texas, the Panhandle, and East Texas. Garza County shrank the most at -22%.




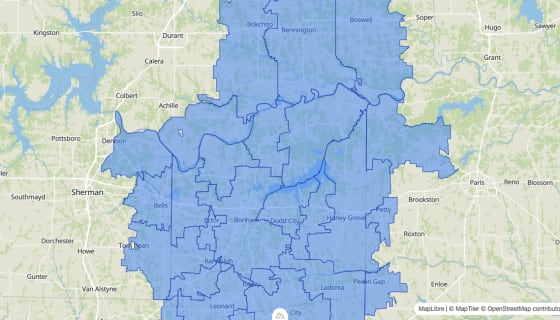


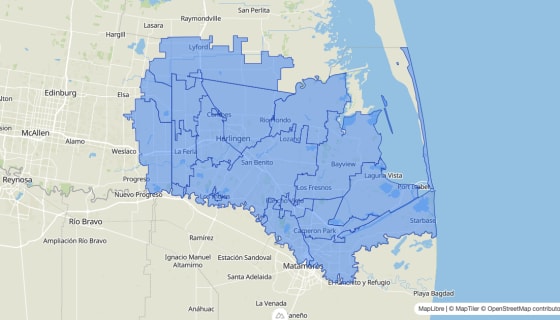

Texas Top 20 Fastest Growing Counties (2020-2025)
The 20 fastest-growing counties in Texas by percentage. Kaufman County leads at +42.2%, followed by Liberty (+31.2%) and Rockwall (+28.9%).


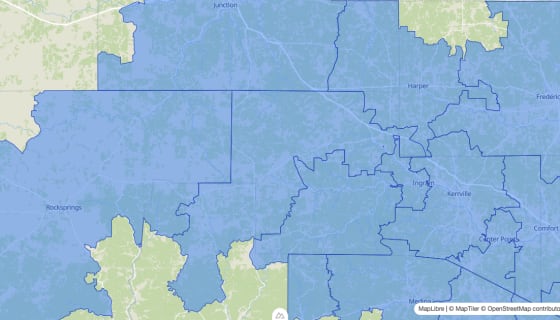


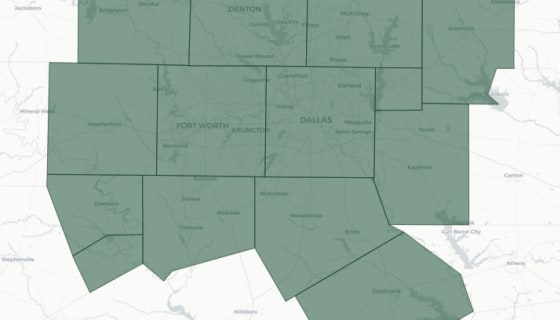
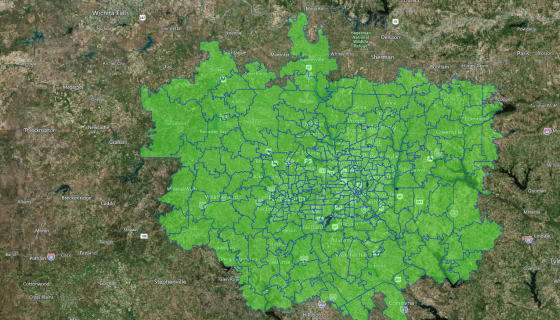
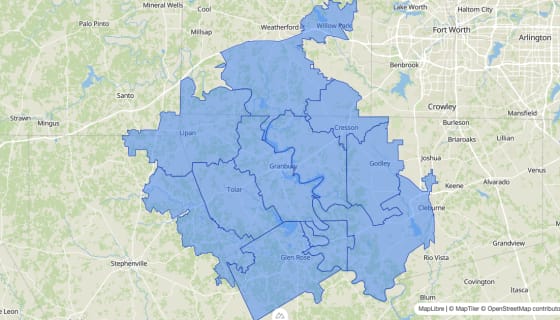
DFW Counties — Population Growth 2020-2025
Population growth across the DFW metroplex. Kaufman County leads at +42%, while Dallas County grew only +1.9%. The region added 810,000 people in 5 years.
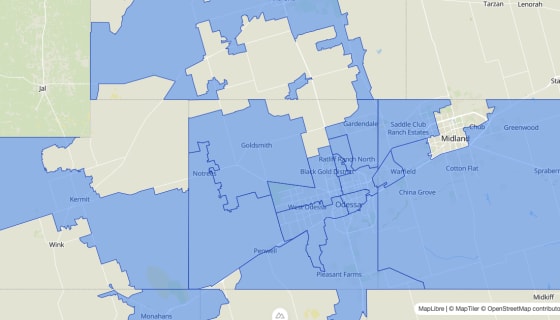

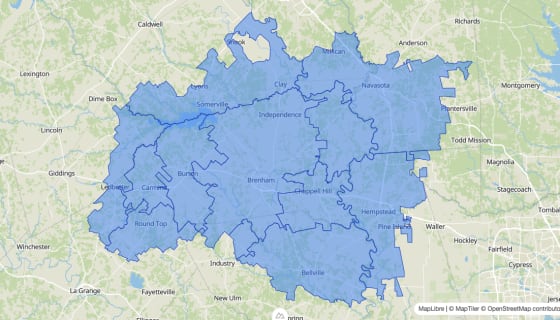


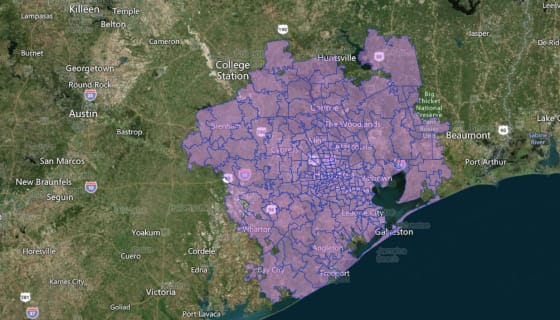
Houston Metro — Population Growth 2020-2025
Houston-area county growth. Montgomery County added 155K people (+25%). Harris County added the most in Texas (+311K). Liberty County grew 31%.

San Antonio Metro — Population Growth 2020-2025
San Antonio-area growth. Comal County leads at +28%. Bexar County added 145K people. Kendall County +20%.
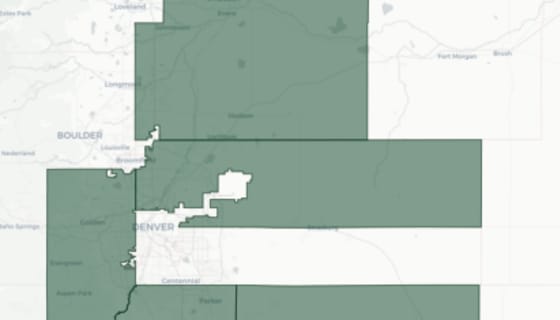
Denver County Boundary
City and County of Denver boundary.


Austin Metro — Population Growth 2020-2025
Austin-area growth. Hays County +25%, Williamson +22%, Bastrop +21%. Travis County (Austin proper) grew only 7.2%.

Nashville-Davidson County Boundary
Davidson County boundary (Nashville consolidated city-county).